So, you're curious about how meteorologists utilize isotherms and isobars to decode weather patterns? These essential tools play a crucial role in the intricate process of weather analysis and prediction.
By understanding the significance of isotherms and isobars, you'll gain insight into the intricate world of meteorology and how these tools are key to unraveling the mysteries of weather patterns.
Stay tuned to uncover the intricate ways in which meteorologists leverage these tools to provide accurate weather forecasts and make informed predictions.
Key Takeaways
- Isotherms and isobars are essential tools used by meteorologists in weather analysis and forecasting.
- Isotherms help visualize temperature variations and identify areas of contrasting air pressure.
- Isobars aid in determining wind patterns, assessing weather systems' strength, and identifying high and low-pressure areas.
- Understanding and interpreting isotherm and isobar patterns provide crucial information for predicting weather changes, tracking storm movement, and planning aviation and maritime operations.
Understanding Isotherms
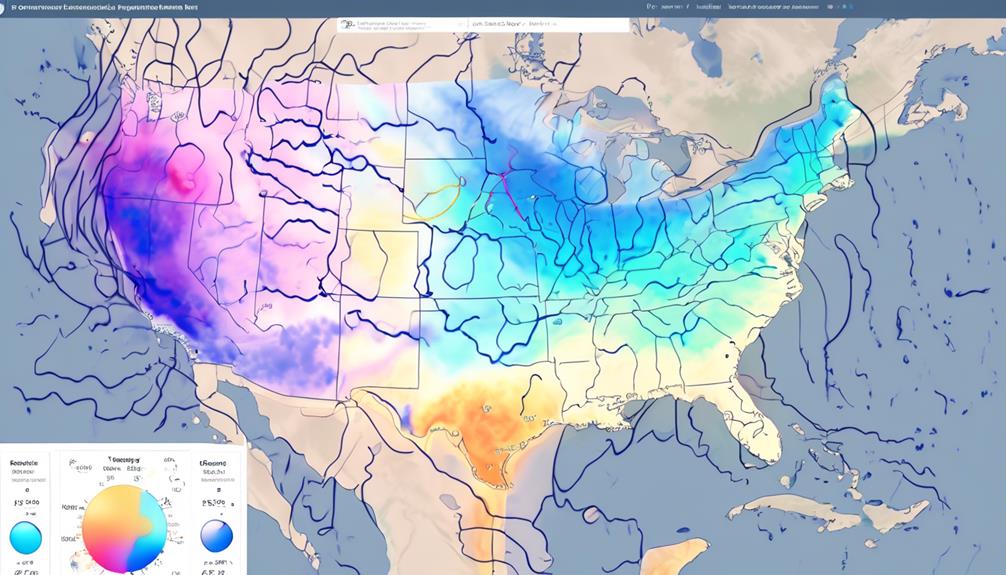
By connecting points of equal temperature, isotherms help meteorologists visualize temperature variations across a region. In the United States, isotherms play a crucial role in understanding weather patterns and climate trends.
These lines on weather maps provide valuable insight into the distribution of warm and cold air masses, helping meteorologists identify areas of contrasting air pressure and potential weather disturbances. By analyzing isotherms, meteorologists can pinpoint regions experiencing temperature gradients, which can indicate the presence of frontal boundaries and potential storm systems.
Changes in isotherms over time offer important clues about evolving weather patterns and long-term climate trends, aiding in the forecasting of temperature fluctuations and identifying areas susceptible to extreme heat or cold. Understanding the significance of isotherms is essential for interpreting complex temperature variations and their impact on weather conditions, making them an indispensable tool for meteorologists in the United States and around the world.
Interpreting Isotherm Patterns
Interpreting isotherm patterns allows meteorologists to discern temperature variations and distribution across a given region, aiding in the analysis of weather trends and potential disturbances. When analyzing these patterns on weather maps, consider the following:
- Isotherms on weather maps represent lines connecting points of equal temperature, providing a visual representation of temperature gradients across a region.
- The spacing between isotherms can indicate the rate of temperature change within an area, helping meteorologists identify areas of rapid temperature change or more gradual transitions.
- Clustering or spreading out of isotherms can reveal localized temperature variations, highlighting areas of potential weather disturbances or microclimates.
- Comparing isotherm patterns over time can help track changes in temperature distribution, enabling meteorologists to monitor long-term weather trends and make more accurate forecasts.
Significance of Isotherms in Weather Forecasting
Understanding isotherms is crucial for meteorologists in accurately predicting temperature patterns and weather changes. Isotherms, indicating areas with the same temperature, play a significant role in weather forecasting. They aid in identifying temperature patterns and gradients, which are essential for predicting weather changes and understanding climate variations.
By tracking the movement of air masses and fronts, isotherms help meteorologists predict the onset of weather systems. Additionally, they assist in analyzing temperature variations over different geographical regions, aiding in predicting local and regional weather conditions.
Isotherms are also vital for understanding the distribution of heat across the Earth's surface, which is crucial for assessing weather and climate patterns. In summary, isotherms are indispensable tools for meteorologists, providing crucial information about temperature distribution and aiding in the accurate prediction of weather patterns and changes.
Exploring Isobars in Meteorology
Meteorologists utilize isobars to analyze pressure systems and identify wind patterns, building on the crucial role of isotherms in weather forecasting discussed earlier. Understanding isobars is essential for predicting weather conditions and planning for aviation and maritime operations.
Here are some key points to consider when exploring isobars in meteorology:
- Isobars are lines on a weather map connecting areas of equal atmospheric pressure.
- Isobars help in determining wind patterns and assessing the strength of weather systems.
- Meteorologists use isobars to identify high and low-pressure areas and analyze pressure systems.
- Isobars aid in weather forecasting and tracking storm movement.
Analyzing Isobar Arrangements
When analyzing isobar arrangements, closely observe the spacing and distribution of isobars on a weather map to gain insights into wind speed and direction.
The spacing between isobars indicates the wind speed, with closely spaced isobars suggesting strong winds and widely spaced isobars indicating light winds.
Additionally, the distribution of isobars helps in determining wind direction. Isobars that form closed circles or ovals signify areas of high or low pressure systems, providing crucial information for weather forecasting.
Meteorologists rely on analyzing isobar arrangements to predict weather patterns and storm movements, as these arrangements reveal the atmospheric pressure distribution across different regions.
Areas with steep pressure gradients, characterized by tightly packed isobars, often experience turbulent weather conditions, while regions with more evenly spaced isobars generally have calmer weather.
Utilizing Isobar Data for Weather Prediction
As you explore the utilization of isobar data for weather prediction, consider how closely analyzing isobar arrangements on a weather map translates into valuable insights for forecasting wind patterns and weather system movements. By delving into isobar data, meteorologists gain crucial information that aids in making accurate weather predictions.
Here's how isobar data is instrumental in weather prediction:
- Identifying areas of high and low pressure: Isobar data allows meteorologists to pinpoint regions of high and low pressure, which are essential for understanding and forecasting weather patterns.
- Predicting storm strength and direction: By analyzing isobar data, meteorologists can forecast the strength and direction of storms and weather fronts, providing valuable insights for disaster preparedness and response.
- Forecasting changes in weather conditions: Isobar data helps meteorologists predict changes in weather conditions over specific areas, enabling them to provide timely and accurate weather forecasts to the public.
- Understanding weather-related phenomena: Isobar data is crucial for understanding and predicting various weather-related phenomena and their potential impacts, contributing to improved weather forecasting and public safety.
Utilizing isobar data for weather prediction is a fundamental aspect of meteorology, providing essential information for understanding and anticipating weather patterns and phenomena.
Isotherm and Isobar Applications in Meteorology
Understanding the applications of isotherms and isobars in meteorology is crucial for interpreting temperature and pressure patterns. Meteorologists utilize isotherms to analyze temperature gradients and identify temperature patterns across regions. These lines on weather maps connecting points of equal temperature help visualize temperature patterns, aiding in weather forecasting, storm tracking, and climate research. On the other hand, isobars are used to understand pressure systems, analyze wind patterns, and predict weather fronts. Connecting points of equal atmospheric pressure, isobars assist in identifying high and low-pressure areas, essential for aviation operations and weather prediction.
| Isotherm Applications | Isotherms help visualize temperature patterns, aiding in weather forecasting, storm tracking, and climate research. |
|---|---|
| Isobar Applications | Isobars assist in identifying high and low-pressure areas, essential for aviation operations and weather prediction. |
These essential tools are fundamental in meteorology, providing crucial insights for weather analysis and prediction.
Advanced Techniques for Isotherm and Isobar Analysis
To gain a deeper understanding of meteorological analysis, meteorologists employ advanced techniques to interpret isotherm and isobar maps for precise weather forecasting. These advanced techniques include:
- Identifying temperature gradients and pressure systems using isotherms and isobars
- Predicting weather fronts and precipitation patterns by studying isotherms and isobars on weather maps
- Understanding the complex interactions of isotherms and isobars to make accurate weather predictions
- Utilizing specialized software and computer models to analyze and visualize isotherm and isobar data
Advanced analysis of isotherms and isobars enables meteorologists to make more accurate and detailed weather predictions, providing essential information for public safety and various industries. These advanced techniques require specialized training and expertise to interpret the complex relationships between temperature and pressure, ultimately leading to more effective weather forecasting.
If you're interested in delving deeper into meteorological analysis, consider exploring the advanced techniques used by meteorologists to interpret isotherm and isobar maps for precise weather forecasting. If you're unable to view isotherm and isobar maps on your browser, consider seeking alternative methods to access this critical weather information.
Integrating Isotherms and Isobars in Weather Models
Integrating isotherms and isobars in weather models enhances meteorologists' ability to identify temperature gradients and pressure systems, contributing to more accurate weather forecasting.
By incorporating isotherms, which are lines connecting points of equal temperature, and isobars, which connect points of equal pressure, meteorologists can visualize temperature and pressure patterns across a geographical area.
Weather models utilize these tools to predict precipitation patterns, wind direction, and the movement of weather systems.
The combination of isotherms and isobars aids in identifying high and low-pressure areas on weather maps, crucial for anticipating the development and movement of storms.
Additionally, integrating isotherms and isobars assists in agricultural planning by providing insights into temperature variations and pressure changes that impact crop growth.
Frequently Asked Questions
How Does Meteorologists Use Isotherms and Isobars?
You use isotherms to illustrate temperature patterns and identify variations across a region. Isobars are used to depict pressure systems, helping analyze wind patterns and identify areas of high and low pressure. Both tools are essential for weather forecasting and analysis.
What Are Isobars and Isotherms Used to Show on Weather Maps?
Do you wonder how isotherms and isobars impact weather maps? Isotherms display temperature patterns, while isobars reveal pressure systems. These essential tools help meteorologists analyze temperature gradients, identify pressure areas, and predict wind and precipitation patterns.
How Do Isobars Help Meteorologists Predict Weather?
Isobars help you predict weather patterns by showing areas of high and low pressure, indicating wind direction and strength. They're essential for understanding weather fronts and temperature gradients, providing critical information for forecasting and safety measures.
How Is a Map With Isotherms Helpful to Meteorologists?
When reading a map with isotherms, you can easily spot temperature patterns. Meteorologists rely on these to track air masses and forecast temperature changes in specific areas, making it a vital tool for weather prediction.